
Page 24 - Nurol YES Sustainability Report
P. 24
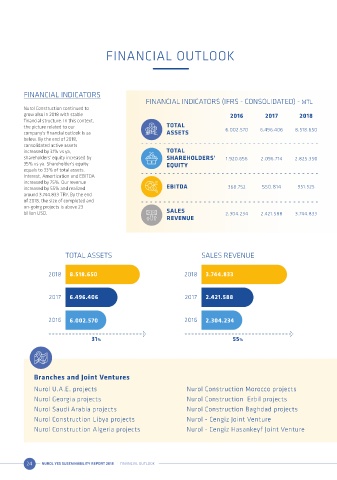
FINANCIAL OUTLOOK


          FINANCIAL INDICATORS                                                                                                   ECONOMIC VALUE: GENERATED & DISTRIBUTED
                                                     FINANCIAL INDICATORS (IFRS - CONSOLIDATED) - MTL                                                                                                                                Bin TL
          Nurol Construction continued to
          grow also in 2018 with stable                                             2016        2017        2018                 I. DIRECT ECONOMIC VALUE GENERATED
          financial structure. In this context,
          the picture related to our                         TOTAL                6.002.570   6.496.406    8.518.650             Net Sales                                                                                       3.744.833
          company's financial outlook is as                   ASSETS
          below. By the end of 2018,                                                                                             Dividends from Equity Method Investment Activity                                                  473.097
          consolidated active assets
          increased by 31% vs ya,                            TOTAL                                                               Revenue from Investment activities                                                                197.500
          shareholders' equity increased by                  SHAREHOLDERS’        1.920.656   2.096.714    2.825.350             Financial Income                                                                                  504.913
          35% vs ya. Shareholder's equity                    EQUITY
          equals to 33% of total assets.                                                                                         Revenue                                                                                         4.920.343
          Interest, Amortization and EBITDA
          increased by 75%. Our revenue                                                                                          II. DIRECT ECONOMIC VALUE DISTRIBUTED
          increased by 55% and realized                      EBITDA                368.752     550.814      951.525
          around 3.744.833 TRY. By the end                                                                                       COGS (Including Operational Costs)                                                              2.860.333
          of 2018, the size of completed and
          on-going projects is above 23                                                                                          Administrative Expenses                                                                            68.136
          billion USD.                                       SALES                2.304.234   2.421.588    3.744.833
                                                             REVENUE                                                             Expenses for Society Development Activities                                                         1.498
                                                                                                                                 Financial Expenses                                                                               1.973.586

                                                                                                                                 Taxes (Government related)                                                                         -1.800
                                                                                                                                 Total Expenses                                                                                  4.901.753
                         TOTAL ASSETS                                    SALES REVENUE
                                                                                                                                 III. PROFIT/LOSS (GENERATED ECONOMIC VALUE)
                   2018   8.518.650                                2018    3.744.833                                             Total Revenues                                                                                  4.920.343

                                                                                                                                 Total Expenses                                                                                  4.901.753

                   2017   6.496.406                                2017    2.421.588                                             Profit/Loss (Generated Economic Value)                                                              18.590


                                                                                                                                 Notes:
                   2016   6.002.570                                2016    2.304.234                                             No significant penalties for 1. Reporting Period.


                                  31%                                               55%


             Branches and Joint Ventures

             Nurol U.A.E. projects                                  Nurol Construction Morocco projects                              Gama - Nurol Joint Venture                            Özgün - Nurol Joint Venture
             Nurol Georgia projects                                 Nurol Construction  Erbil projects                               Nurol - Özaltın - Makyol - Astaldi - Göçay            Nurol-Gülermak Joint Venture
                                                                                                                                     Joint Venture (NÖMAYG)
             Nurol Saudi Arabia projects                            Nurol Construction Baghdad projects                                                                                    Nurol-Gülermak-Makyol Joint Venture
                                                                                                                                     Nurol - Yüksel - Özka - YDA Joint Venture
             Nurol Construction Libya projects                      Nurol - Cengiz Joint Venture                                                                                           Nurol-Mesa Joint Venture
                                                                                                                                     Nurol - Yüksel - YDA - Özka Joint Venture
             Nurol Construction Algeria projects                    Nurol - Cengiz Hasankeyf Joint Venture                                                                                 Nurol-Gülsan Joint Venture


           24   NUROL YES SUSTAINABILITY REPORT 2018  FINANCIAL OUTLOOK                                                                                                                                                                25