
Page 26 - Nurol YES Sustainability Report
P. 26
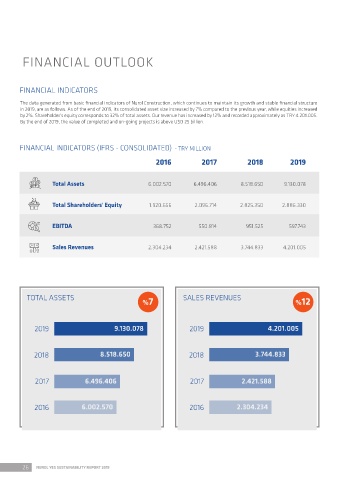
FINANCIAL OUTLOOK
FINANCIAL INDICATORS ECONOMIC VALUE: GENERATED & DISTRIBUTED
TRY Thousand
The data generated from basic financial indicators of Nurol Construction, which continues to maintain its growth and stable financial structure
in 2019, are as follows. As of the end of 2019, its consolidated asset size increased by 7% compared to the previous year, while equities increased I. DIRECT ECONOMIC IMPACT
by 2%. Shareholder's equity corresponds to 32% of total assets. Our revenue has increased by 12% and recorded approximately as TRY 4.201.005.
By the end of 2019, the value of completed and on-going projects is above USD 25 billion. Net Sales 4.201.005
Dividends from Equity Method Investment Activity 603.577
Revenue from Investment Activities 132.341
FINANCIAL INDICATORS (IFRS - CONSOLIDATED) - TRY MILLION
Financial Income 343.061
2016 2017 2018 2019 Revenue 5.279.984
II. ECONOMIC VALUE DISTRIBUTED
Total Assets 6.002.570 6.496.406 8.518.650 9.130.078
COGS (Including Operational Costs) 3.717.354
Administrative Expenses 24.376
Total Shareholders' Equity 1.920.656 2.096.714 2.825.350 2.886.330
Expenses for Society Development Activities 1.891
Financial Expenses 1.492.015
EBITDA 368.752 550.814 951.525 597.743
Taxes (Government related) 14.496
Total Expenses 5.250.132
Sales Revenues 2.304.234 2.421.588 3.744.833 4.201.005
III. PROFIT/LOSS (GENERATED ECONOMIC VALUE)
Revenue 5.279.984
Total Expenses 5.250.132
Profit/Loss (Generated Economic Value) 29.852
TOTAL ASSETS SALES REVENUES
%7 %12
Notes:
1. No significant penalty fees have been incurred within the reporting period.
2019 9.130.078 2019 4.201.005
BRANCHES AND PARTNERSHIPS
2018 8.518.650 2018 3.744.833
Nurol L.L.C Nurol - Cengiz Joint Venture
Nurol Georgia L.L.C Nurol - Cengiz Hasankeyf Joint Venture
Nurol Georgia Branch Gama - Nurol Joint Venture
2017 6.496.406 2017 2.421.588 Nurol Saudi Arabia Branch Nurol - Özaltın - Makyol - Astaldi - Göçay Joint Venture (NÖMAYG)
Nurol Construction Libya Branch Nurol - Yüksel - Özka - YDA Joint Venture
Nurol Construction Algeria Branch Nurol - Yüksel - YDA - Özka Joint Venture
2016 6.002.570 2016 2.304.234 Nurol Construction Morocco Branch Özgün - Nurol Joint Venture
Nurol Construction Erbil Branch Nurol-Gülermak Joint Venture
Nurol Construction Baghdad Branch Nurol-Gülermak-Makyol Joint Venture
Nurol-Mesa Joint Venture
Nurol-Gülsan Joint Venture
26 NUROL YES SUSTAINABILITY REPORT 2019 FINANCIAL OUTLOOK 27