Page 40 - 2022 NUROL YES SUSTAINABILITY REPORT
P. 40

İş Kaynaklı Yaralanma Oranı
                                                                                           140
                                                                                           120
                                                                                           100
                                                                                           80
                                                                                           60
                                                                                           40
                                                                                           20
                                                                                            0
                                                                                                 Romanya 3B5   Boukhroufa   Souk Tleta Barajı  ÜAG Metro  ICTH Projesi
                                                                                                 Otoyol Projesi  Barajı Projesi   Projesi    Projesi
                                                                                                 OCCUPATIONAL          WORKING     OUR    PERFORMANCE          APPLICABLE
                                               CORPORATE   FINANCIAL         SUSTAINABILITY   ENVIRONMENTAL   VALUE CHAIN                           UNGC CONTENT
                                                PROFILE   OUTLOOK  GOVERNANCE  APPROACH  AWARENESS  HEALTH AND   MANAGEMENT  LIFE IN NUROL   CONTRIBUTION TO   INDICATORS   INDEX  GRI SECTOR
                                                                                                                        2019
                                                                                                                                  2021
                                                                                                   SAFETY         2018 CONSTRUCTION 2020  SOCIETY  2022  DETAILS  STANDARD
                                                                                                                Grafik 5:  Projeler İş Kaynaklı Yaralanma Oranları
           ENVIRONMENTAL AWARENESS
                                                                                                               Yıllara Göre Kurum İçi Enerji Tüketimi (GJ)
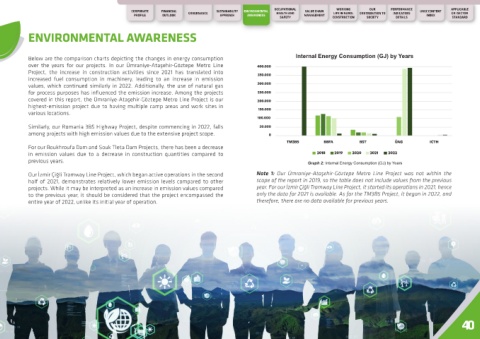
           Below are the comparison charts depicting the changes in energy consumption                   Internal Energy Consumption (GJ) by Years
           over the years for our projects. In our Ümraniye-Ataşehir-Göztepe Metro Line    400.000
           Project,  the  increase  in construction  activities  since  2021  has  translated  into   350.000
           increased fuel consumption in machinery, leading to an increase in emission
           values, which continued similarly in 2022. Additionally, the use of natural gas   300.000
           for process purposes has influenced the emission increase. Among the projects   250.000
           covered in this report, the Ümraniye-Ataşehir-Göztepe Metro Line Project is our   200.000
           highest-emission project due to having multiple camp areas and work sites in     150.000
           various locations.
                                                                                           100.000
           Similarly, our Romania 3B5 Highway Project, despite commencing in 2022, falls    50.000
           among projects with high emission values due to the extensive project scope.        0
                                                                                                      TM3B5        BBFA        BST          ÜAG         ICTH
           For our Boukhroufa Dam and Souk Tleta Dam Projects, there has been a decrease
           in emission values due to a decrease in construction quantities compared to                          2018  2019   2020  2021  2022
           previous years.                                                                                    Graph 2: Internal Energy Consumption (GJ) by Years
                                                                                                               Grafik 2:  Yıllara Göre Kurum İçi Enerji Tüketimi (GJ)
           Our İzmir Çiğli Tramway Line Project, which began active operations in the second   Note 1:  Our Ümraniye-Ataşehir-Göztepe Metro Line Project was not within the
           half of 2021, demonstrates relatively lower emission levels compared to other   scope of the report in 2019, so the table does not include values from the previous
           projects. While it may be interpreted as an increase in emission values compared   year. For our İzmir Çiğli Tramway Line Project, it started its operations in 2021, hence
           to the previous year, it should be considered that the project encompassed the   only the data for 2021 is available. As for the TM3B5 Project, it began in 2022, and
           entire year of 2022, unlike its initial year of operation.                      therefore, there are no data available for previous years.
                                                                                                      Enerji Tüketimi Kaynaklı Sera Gazı Emisyonlarımız (tCO2e)
                                                                                          90.000
                                                                                          80.000
                                                                                          70.000
                                                                                          60.000
                                                                                          50.000
                                                                                          40.000
                                                                                          30.000
                                                                                          20.000
                                                                                           10.000
                                                                                              0
                                                                                                    TM3B5        BBFA         BST         ÜAG         ICTH
                                                                                                                    2018  2019  2020  2021   2022

                                                                                                        Grafik 3:  Yıllara Göre Enerji Tüketimi Kaynaklı Sera Gazı Emisyonları(tCO₂e)
                                                                                                                                                                   40


                                                                                                                Çalışan Cinsiyet Dağılımı - Merkez Ofis

                                                                                          100%
                                                                                           90%
                                                                                           80%
                                                                                           70%
                                                                                                     76%          76%          76%          73%          75%
                                                                                           60%
                                                                                           50%
                                                                                           40%
                                                                                           30%
                                                                                           20%
                                                                                           10%       24%          24%          24%          27%          25%
                                                                                            0%
                                                                                                     2018         2019         2020         2021         2022

                                                                                                                          Kadın  Erkek
                                                                                                                 Grafik 6: Merkez Ofis Kadın Çalışan Oranı


                                                                                                                          4%
                                                                                                                                                     Diğer
                                                                                                                                    23%
                                                                                                                 21%                                 Gürültü
                                                                                                                                                     Proje Bilgi İstemi
                                                                                                                                                     Titreşim
                                                                                                                                                     Toz
                                                                                                                                                     Ulaşım
                                                                                                               3%                                    Yol Kirlenmesi
                                                                                                                8%
                                                                                                                                      32%
                                                                                                                     9%


                                                                                                  Gra k 7: Ümraniye - Ataşehir - Göztepe Metro Hattı Projesi 2022 Yılı Yerel Toplum Bildirimleri
   35   36   37   38   39   40   41   42   43   44   45