
Page 57 - Nurol YES Sustainability Report
P. 57
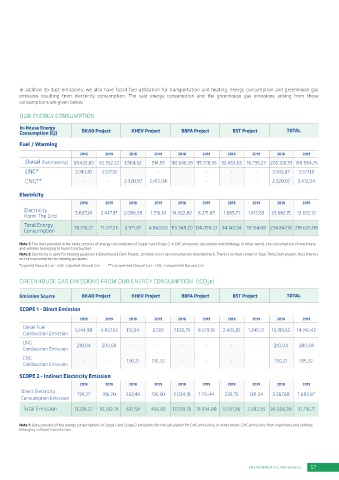
ENVIRONMENTAL TRAINING HOURS - 2019                                                                                    In addition to dust emissions, we also have fossil fuel utilization for transportation and heating; energy consumption and greenhouse gas
                                                                                                                               emission resulting from electricity consumption. The said energy consumption and the greenhouse gas emissions arising from these
                                                 Total Training Hours               Training Hour Per Employee                 consumptions are given below.
                                                  (employee.hour)                       (hour/employee)
                                                                                                                               OUR ENERGY CONSUMPTION
        All Trainings
        HQ                                            2.231                                34,344                              In-House Energy                                                                               TOTAL
                                                                                                                               Consumption (GJ)      BKAO Project     KHEV Project      BBFA Project      BST Project
        Balıkesir Motorway Project                   17.752,75                              50,63
                                                                                                                               Fuel / Warming
        Eyiste Viaduct Project                       3.823,5                                44,59
                                                                                                                                                     2018    2019    2018     2019     2018    2019     2018     2019    2018     2019
        Boukhroufa Dam Project                       3.583,5                                19,31
                                                                                                                                 Diesel (fuel/heating)  69.425,65  65.552,22  1.564,52   914,95  101.646,39  115.778,36  32.463,63  16.739,23  205.100,19  198.984,76
        Souk Tleta Dam Project                        1.508                                 6,58
                                                                                                                                 LNG*             3.743,87  3.577,18  -        -        -       -        -        -     3.743,87  3.577,18
                                                                                                                                 CNG**               -        -     2.320,97  2.412,04  -       -        -        -     2.320,97  2.412,04
        ENERGY AND EMISSION MANAGEMENT                                                                                         Electricity

        We determine our emission sources through environmental   are planned and positioned to minimize dust production potential. A                2018    2019    2018     2019     2018    2019     2018     2019    2018     2019
        dimensions risk assessment works we carry out in our projects, we   portion of the said emissions are not subject to emission permits for   Electricity
        analyze the e ects of these sources and ensure that necessary   the projects in our country, but we still carry out measurements.   Form The Grid   5.607,24   2.447,97  2.086,38   1.516,61  14.302,82  8.271,87   1.685,71   1.415,65   23.682,15   13.652,10
        actions are taken to minimize the impact on the environment. We   We regularly control dust emission from concrete plant and quarries,
        also follow the legal permission processes arising from emission   particulate substance 10 (PM10) and collapsible dust values at regular   Total Energy    78.776,77   71.577,36   5.971,87   4.843,60  115.949,20  124.050,23  34.149,34  18.154,88  234.847,18  218.626,08
        sources. We have to consider all our emission sources, which directly   intervals. In order to prevent dusting, we construct dust barriers, we   Consumption
        and indirectly a ect greenhouse gas.                  irrigate in areas where we work, we use pulverized systems (dust
        We  ensure that all measurements  are  carried  out every  2 years in   reduction systems). We minimize dusting by closing the crushing   Note 1: The data provided in the table consists of energy consumption of Scope 1 and Scope 2 in GHG emissions calculation methodology, in other words, the consumption of machinery
                                                                                                                               and vehicles belonging to Nurol Construction.
        order to check whether there is any deviation from the data stipulated   screening unit conveyor and conveyor belt tops. We ensure periodic   Note 2: Electricity is used for heating purposes in Boukhroufa Dam Project, so there is no fuel consumption recorded here. There is no heat center in Souk Tleta Dam project, thus there is
        in the permit area in concrete plants and asphalt plants that are   maintenance of the concrete plant cement silos regularly and the   no fuel consumption for heating purposes.
        subject to emission permit, which are managed by our subcontractors.   filter system is renewed. In our Balıkesir Motorway Project, a soil   *Liqufied Natural Gas - LNG: Liqiufied Natural Gas         ** Compressed Natural Gas - CNG: Compressed Natural Gas
        In these facilities, CO, NO , NO , SO , dust, volatile organic material   embankment was made around the concrete plants that we think is
                           X   2   2
        measurements are made and compliance to limit values is checked.   close to the settlement, and trees were planted to prevent dust from   GREENHOUSE GAS EMISSIONS FROM OUR ENERGY CONSUMPTION  (tCO e)
        In our motorway projects, although emission of greenhouse gases   spreading to the environment. In the Souk Tleta Dam Project, dust                                                      2
        occurs from asphalt plant activities, emissions from steam boilers   level is minimized by installing a sprinkler irrigation system on the   Emission Source  BKAO Project  KHEV Project  BBFA Project  BST Project  TOTAL
        occur in beam casting areas. In our plant systems, we carry out   casting belts of the crusher on site.
        insulation work in order to reduce heat loss. At the same time, waste   As Nurol Construction, we regularly record our energy consumption
        gases are released into the atmosphere via the vertical air outlet,   data. The data we recorded includes our fossil fuels from heating, our   SCOPE 1 - Direct Emission
        which can be transported unobstructed by the free air flow. Chimney   electricity consumption, the fuels we use for vehicles. Based on the      2018  2019    2018     2019     2018    2019     2018     2019    2018     2019
        heights are compatible with the legislation. Considering the locations   data we have recorded, we are improving our e orts to reduce our   Diesel Fuel
        of the dominant wind and receiving environments, warehouse sites   energy consumption.                                                     5.144,98   4.857,93   115,94   67,80   7.532,79   8.579,18   2.405,81   1.240,51   15.199,52   14.745,42
                                                                                                                                Combustion Emission
                                                                                                                                LNG                210,04   200,68    -        -        -       -        -        -     210,04   200,68
                                                                                                                                Combustion Emission
              By regularly maintenaning our systems exposed to heat,       One of the most important energy consumption indicators in   CNG          -        -      130,21  135,32     -       -        -        -      130,21  135,32
            leakage and unnecessary energy loss are prevented.   our dam projects is the energy spent during the transportation   Combustion Emission
                                                                 of excavation-filling materials. In order to reduce this energy
              Our employees are informed about energy saving and   consumption, road routes that will provide minimum          SCOPE 2 - Indirect Electricity Emission
            unconscious consumption is prevented.                consumption are determined, thus saving fuel consumption.                           2018    2019    2018     2019     2018    2019     2018     2019    2018     2019
                                                                                                                                Direct Electricity
              Devices that consume less energy are preferred as much as       All electricity requirements are met through the city grid.   Consumption Emission   724,27   316,20   269,49   195,90   2.034,18   1.176,44   239,75   201,34   3.267,68   1.889,87
            possible. Energy saving bulbs are used in lighting bulbs,   Electric infrastructure; generators are set up to operate only in
            photocells are used for environmental lighting.      the event of a breakdown in the city network. In this way,     Total Emission     11.224,27   10.232,74   631,59   466,82   17.099,76  18.334,80   5.051,36   2.682,35  34.006,98  31.716,71
                                                                 unnecessary use of generators is prevented.
              The heating system is operated in accordance with the air
            temperature, the use of air conditioning is kept at a low level.       Damaged electrical cables are replaced immediately.  Note 1: Data consists of the energy consumptions in Scope 1 and Scope 2 emissions for the calculation for GHG emissions, in other words, GHG emissions from machinery and vehicles
                                                                                                                               belonging to Nurol Construction.


         56   NUROL YES SUSTAINABILITY REPORT 2019                                                                                                                                                             ENVIRONMENTAL AWARENESS  57