Page 20 - 2022 NUROL YES SUSTAINABILITY REPORT
P. 20

OCCUPATIONAL          WORKING     OUR    PERFORMANCE          APPLICABLE
                                               CORPORATE   FINANCIAL         SUSTAINABILITY   ENVIRONMENTAL   VALUE CHAIN                           UNGC CONTENT
                                                PROFILE   OUTLOOK  GOVERNANCE  APPROACH  AWARENESS  HEALTH AND   MANAGEMENT  LIFE IN NUROL   CONTRIBUTION TO   INDICATORS   INDEX  GRI SECTOR
                                                                                                   SAFETY             CONSTRUCTION  SOCIETY  DETAILS            STANDARD
           FINANCIAL OUTLOOK


           FINANCIAL INDICATORS
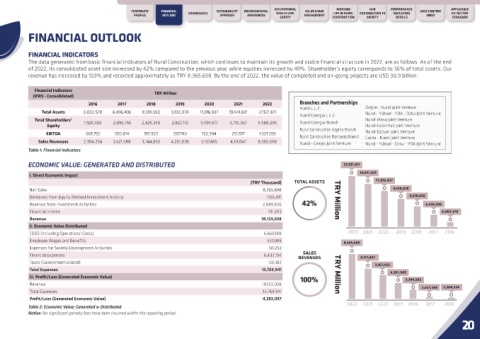
           The data generated from basic financial indicators of Nurol Construction, which continues to maintain its growth and stable financial structure in 2022, are as follows. As of the end
           of 2022, its consolidated asset size increased by 42% compared to the previous year, while equities increased by 49%. Shareholder’s equity corresponds to 36% of total assets. Our
           revenue has increased by 103% and recorded approximately as TRY 8.365.698. By the end of 2022, the value of completed and on-going projects are USD 30,9 billion.

             Financial Indicators
             (IFRS - Consolidated)                     TRY Million
                                2016      2017      2018       2019      2020      2021      2022         Branches and Partnerships
                                                                                                          Nurol L.L.C.           Özgün - Nurol Joint Venture
                Total Assets  6,002,570  6,496,406  8,518,650  9,130,078  11,016,837  19,441,631  27.521.611                     Nurol - Yüksel - YDA - Özka Joint Venture
                                                                                                          Nurol Georgia L.L.C.
             Total Shareholders’   1,920,656  2,096,714  2,825,350  2,827,710  3,599,577  6,713,367  9.988.205  Nurol Georgia Branch  Nurol-Mesa Joint Venture
                 Equity                                                                                                          Nurol-Gülermak Joint Venture
                                                                                                          Nurol Construction Algeria Branch
                 EBITDA        368,752   550,814    951,525   597,743   152,394   291,517   1.321.559                            Nurol-Gülsan Joint Venture
                                                                                                          Nurol Construction Romania Branch  Gama - Nurol Joint Venture
              Sales Revenues  2,304,234  2,421,588  3,744,833  4,201,005  3,167,455  4,111,047  8.365.698  Nurol - Cengiz Joint Venture  Nurol - Yüksel - Özka - YDA Joint Venture
           Table 1: Financial Indicators

           ECONOMIC VALUE: GENERATED AND DISTRIBUTED                                                                      27,521,611

                                                                                                                               19,441,631
           i. Direct Economic Impact
                                                                                         (TRY Thousand)  TOTAL ASSETS                11,016,837
           Net Sales                                                                         8,365,698                                     9,130,078
           Dividends from Equity Method Investment Activity                                    7,155,811               TRY Million               8,518,650
           Revenue from Investment Activities                                                2,089,836     42%                                        6,496,406
           Financial Income                                                                    511,693                                                      6,002,570
           Revenue                                                                           18,123,038
           ii. Economic Value Distributed
           COGS (Including Operational Costs)                                                 6,659,188                    2022 2021  2020  2019  2018  2017  2016
           Employee Wages and Benefits                                                         531,085
                                                                                                                          8,365,698
           Expenses for Society Development Activities                                         50,292
                                                                                                           SALES
           Financial Expenses                                                                 6,403,194
                                                                                                          REVENUES             4,111,047
           Taxes (Government related)                                                          126,182
                                                                                                                                     3,167,455
           Total Expenses                                                                    13,769,941
                                                                                                                                          4,201,005
           iii. Profit/Loss (Generated Economic Value)                                                    100%         TRY Million             3,744,833
           Revenue                                                                           18,123,038
                                                                                                                                                     2,421,588  2,304,234
           Total Expenses                                                                    13,769,941
           Profit/Loss (Generated Economic Value)                                            4,353,097
                                                                                                                           2022  2021  2020  2019  2018  2017  2016
           Table 2: Economic Value: Generated & Distributed
           Notlar: No significant penalty fees have been incurred within the reporting period.
                                                                                                                                                                   20
   15   16   17   18   19   20   21   22   23   24   25