Page 47 - 2022 NUROL YES SUSTAINABILITY REPORT
P. 47

OCCUPATIONAL          WORKING     OUR    PERFORMANCE          APPLICABLE
                                               CORPORATE   FINANCIAL         SUSTAINABILITY   ENVIRONMENTAL   VALUE CHAIN                           UNGC CONTENT
                                                PROFILE   OUTLOOK  GOVERNANCE  APPROACH  AWARENESS  HEALTH AND   MANAGEMENT  LIFE IN NUROL   CONTRIBUTION TO   INDICATORS   INDEX  GRI SECTOR
                                                                                                   SAFETY             CONSTRUCTION  SOCIETY  DETAILS            STANDARD
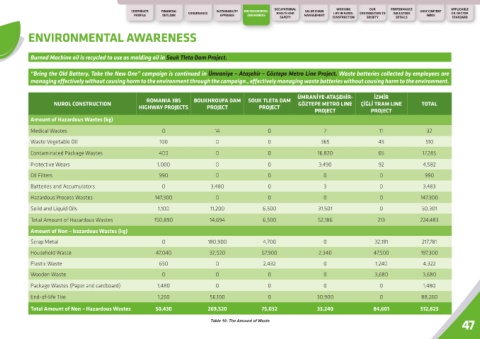
           ENVIRONMENTAL AWARENESS


            Burned Machine oil is recycled to use as molding oil in Souk Tleta Dam Project.

            “Bring the Old Battery, Take the New One” campaign is continued in Ümraniye – Ataşehir – Göztepe Metro Line Project. Waste batteries collected by employees are
            managing effectively without causing harm to the environment through the campaign., effectively managing waste batteries without causing harm to the environment.


                                                                                                         ÜMRANİYE-ATAŞEHİR-         İZMİR
                                                    ROMANIA 3B5      BOUKHROUFA DAM     SOUK TLETA DAM
                    NUROL CONSTRUCTION                                                                    GÖZTEPE METRO LINE    ÇİĞLİ TRAM LINE      TOTAL
                                                  HIGHWAY PROJECTS        PROJECT           PROJECT
                                                                                                               PROJECT             PROJECT
            Amount of Hazardous Wastes (kg)
            Medical Wastes                                0                 14                 0                   7                  11               32
            Waste Vegetable Oil                          100                 0                 0                  365                 45              510

            Contaminated Package Wastes                  400                 0                 0                16,820                65             17,285
            Protective Wears                            1,000                0                 0                 3,490                92             4,582

            Oil Filters                                  990                 0                 0                   0                  0               990
            Batteries and Accumulators                    0                3,480               0                   3                  0              3,483

            Hazardous Process Wastes                   147,300               0                 0                   0                  0              147,300
            Solid and Liquid Oils                       1,100              11,200            6,500               31,501               0              50,301

            Total Amount of Hazardous Wastes           150,890             14,694            6,500               52,186               213           224,483
            Amount of Non – hazardous Wastes (kg)
            Scrap Metal                                   0               180,900            4,700                 0                32,181           217,781

            Household Waste                             47,040             32,520            67,900              2,340              47,500           197,300
            Plastic Waste                                650                 0               2,432                 0                 1,240           4,322

            Wooden Waste                                  0                  0                 0                   0                3,680            3,680
            Package Wastes (Paper and cardboard)        1,480                0                 0                   0                  0               1,480
            End-of-life Tire                            1,260              56,100              0                30,900                0              88,260

            Total Amount of Non – Hazardous Wastes      50,430            269,520            75,032             33,240              84,601          512,823

                                                                                                                                                                   47
                                                                           Table 10: The Amount of Waste
   42   43   44   45   46   47   48   49   50   51   52