
Page 21 - Demo
P. 21
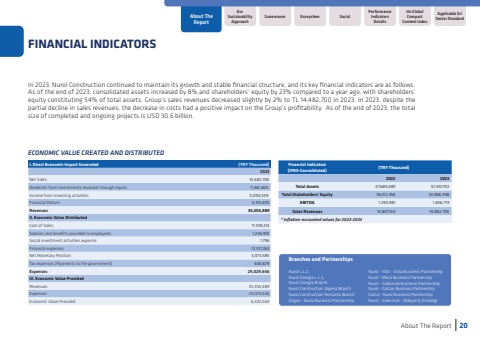
I. Direct Economic Impact Generated (TRY Thousand)2023Net Sales14,482,700Dividends from investments revalued through equity11,461,825Income from investing activities5,094,559Financial Return4,315,405Revenues35,354,489II. Economic Value DistributedCost of Sales11,559,213Salaries and benefits provided to employees1,236,910Social investment activities expense1,796Financial expenses12,517,263Net Monetary Position3,073,585Tax expenses (Payments to the government)640,679Expenses29,029,446III. Economic Value ProvidedRevenues35,354,489Expenses29,029,446Economic Value Provided6,325,043ECONOMIC VALUE CREATED AND DISTRIBUTED Nurol - YDA - Ozka Business PartnershipNurol - Mesa Business PartnershipNurol - G%u00fclermak Business PartnershipNurol - G%u00fclsan Business PartnershipGama - Nurol Business PartnershipNurol - G%u00fclermak - Makyol %u0130%u015f Ortakl%u0131%u011f%u0131Branches and PartnershipsNurol L.L.C.Nurol Georgia L.L.C.Nurol Georgia BranchNurol Construction Algeria BranchNurol Construction Romania Branch%u00d6zg%u00fcn - Nurol Business PartnershipFinancial Indicators (IFRS-Consolidated)(TRY Thousand)20222023Total Assets47,689,48951,947,912Total Stakeholders%u2019 Equity18,412,35623,966,938EBITDA1,394,9811,836,719Sales Revenues14,837,14414,482,700* Inflation-accounted values for 2022-2023In 2023, Nurol Construction continued to maintain its growth and stable financial structure, and its key financial indicators are as follows. As of the end of 2023, consolidated assets increased by 8% and shareholders%u2018 equity by 23% compared to a year ago, with shareholders%u2019 equity constituting 54% of total assets. Group%u2019s sales revenues decreased slightly by 2% to TL 14,482,700 in 2023. In 2023, despite the partial decline in sales revenues, the decrease in costs had a positive impact on the Group%u2019s profitability. As of the end of 2023, the total size of completed and ongoing projects is USD 30.6 billion.About The Report20FINANCIAL INDICATORSOur Sustainability ApproachAbout The ReportUn Global Compact Content IndexApplicable Gri Sector StandardGovernanceSocialPerformance Indicators DetailsEcosystem
